


Projects
NebulOS
Dates
Type
Languages
Libraries & Frameworks
- Apache Mesos
- libHDFS
- Boost (string algorithms & Python)
- Linux system calls
- Curlpp
- SQLite (for caching old task info to disk)
Summary
- run pre-existing software on the cluster, without modification.
- easily write monitoring code in any language to examine the standard error and output streams, memory usage, and CPU usage of tasks launched on the system.
- write code which performs actions, based upon the behavior of the individual tasks. For instance, tasks that meet certain user-defined conditions can be terminated and automatically relaunched with modified parameters or modified input data.
Of course, the system is also able to handle node failures seamlessly and it is aware of data locality; tasks are preferentially performed on nodes that contain the greatest amount of relevant data. The user interface is Python-based, so that the user can issue commands interactively or write Python scripts to build more complex analysis routines. More details can be found here.
Motivation
Researchers at UC Riverside (primarily Miguel A. Aragon-Calvo) needed a Big Data framework to efficiently analyze cosmological simulation data. They desired a fault-tolerant system with high data throughput, capable of being used with existing software. Automated task monitoring was also highly desired, since the system would also be used to perform a large number of simulations with a simulation code prone to hanging. Rather than building a solution that would only work for a specific application, the researchers decided that a general-purpose framework would be more valuable.
Existing tools, such as TORQUE, Hadoop Mapreduce, Hama, and Spark are not ideal for analyzing terabytes or petabytes of scientific data in custom binary formats because these tools are either difficult to use or do not simultaneously allow high data throughput, fault tolerance, and flexibility. Ideally, scientists would like to use pre-existing analysis software so that time, resources, and effort can be spent on doing science rather than writing software. So, the framework needed to be able to handle pre-existing software and get out of the way of the user.
I was hired to develop the framework, described above. I evaluated several available technologies and eventually decided to use Apache Mesos and HDFS as the core components of the system. I then began implementing and testing the software and receiving feedback from potential users. As of March 2015, new features are being planned and user interface improvements are being made. A draft paper, announcing the software, can be found here.
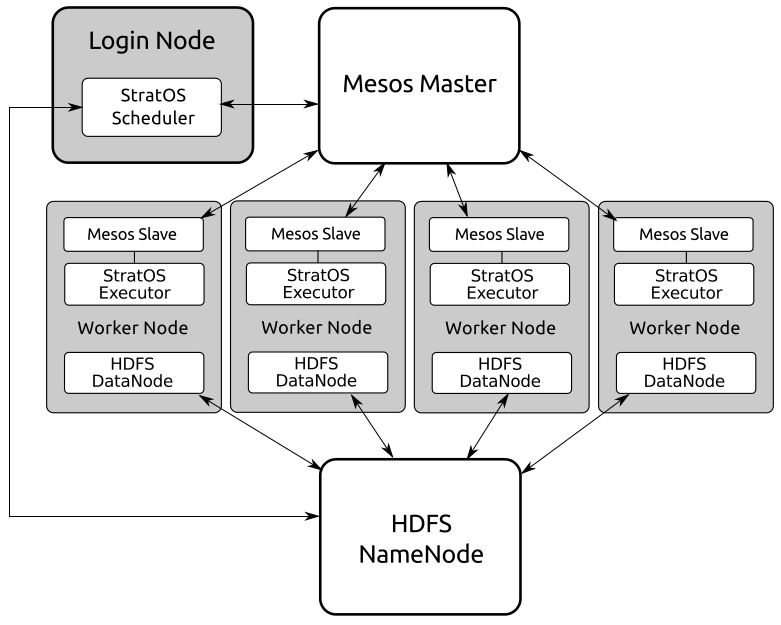
An architectural overview, showing how Mesos, HDFS, and the NebulOS application framework are related to one another.
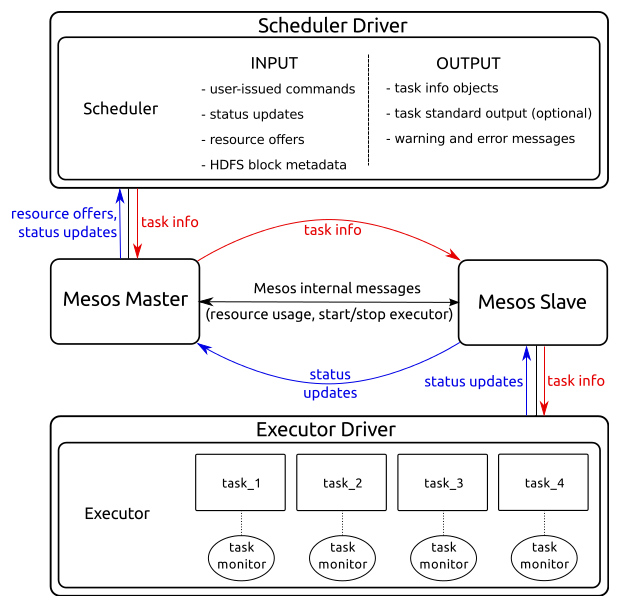
Summary of the interaction between Mesos and the NebulOS framework.
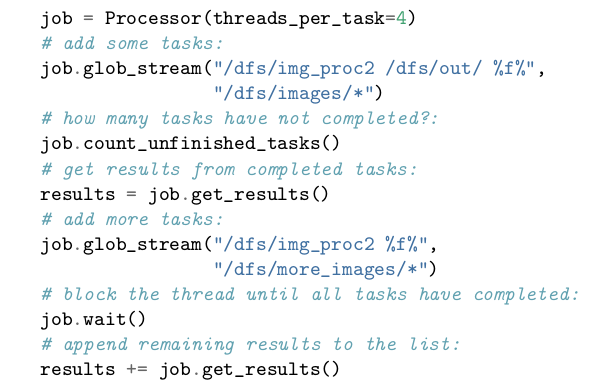
Example usage of the NebulOS Python module interface being used in streaming / interactive mode. The command, 'from nebulos import Processor' must be executed prior to this.
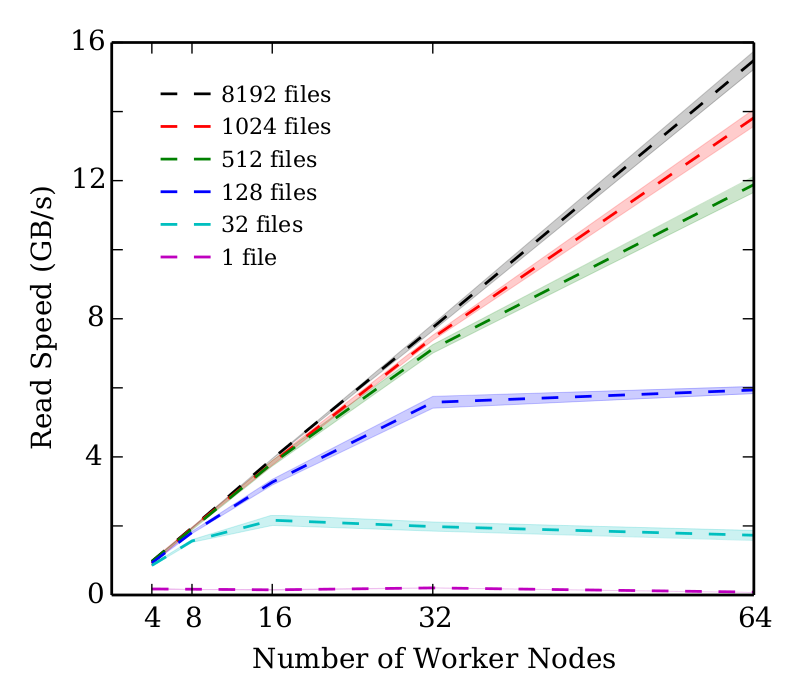
Performance scaling on Amazon Web Services' d2.xlarge EC2 instances when reading single-block files (approx 110 MB per file). The reading speed reported is the net speed, which includes the overhead of submitting the tasks to NebulOS framework, launching the tasks, and retrieving the output of each task.
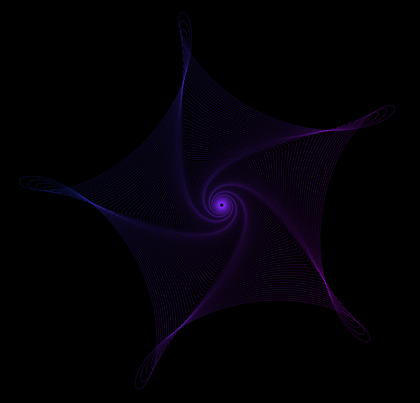
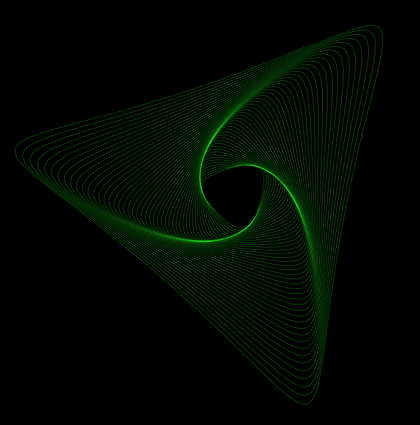
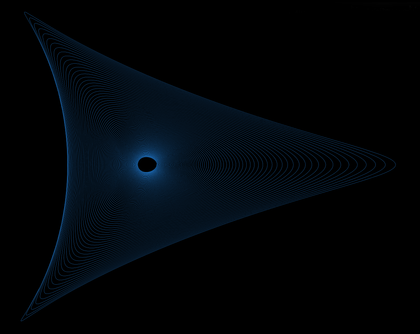
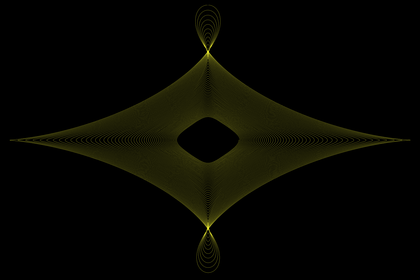
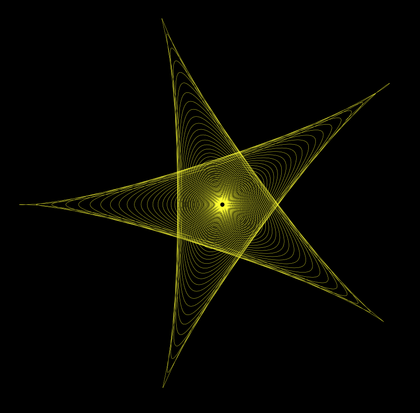
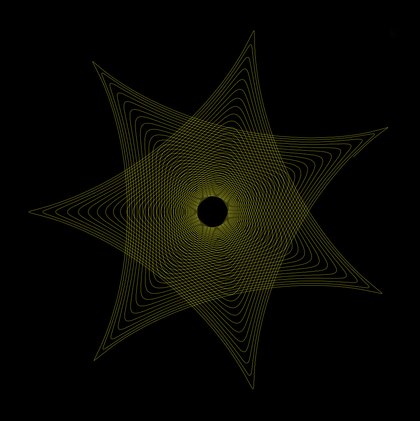
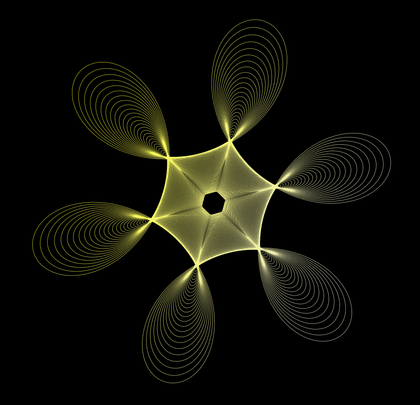
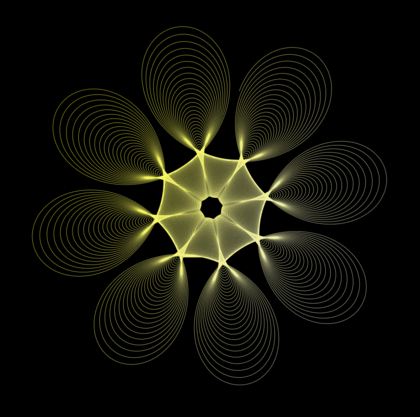
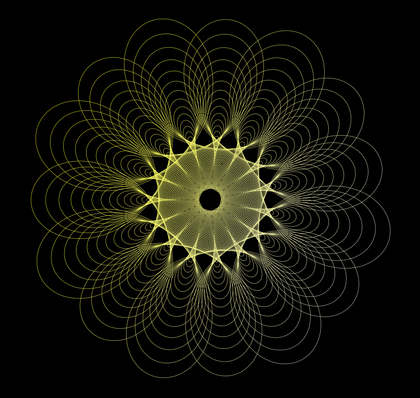
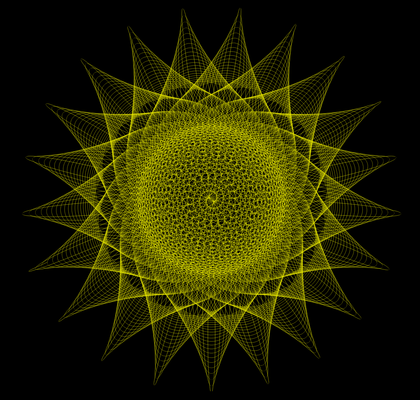
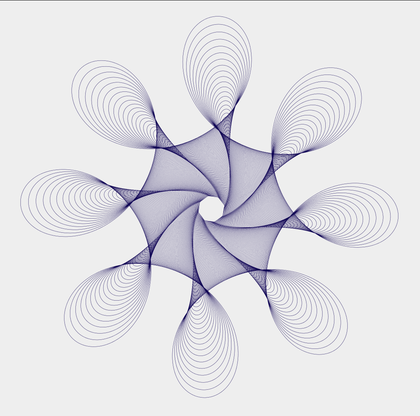
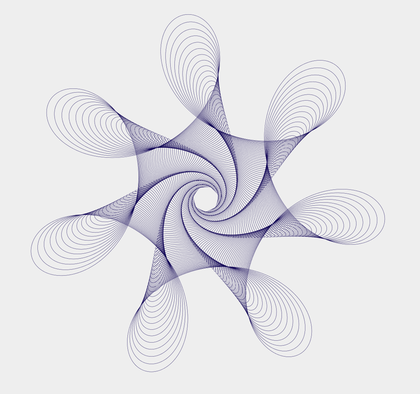
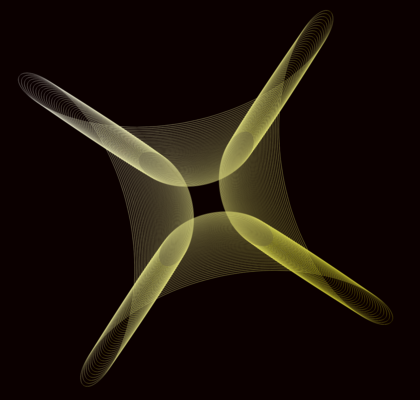
Pretty Parametric Plots
Dates
Type
Languages
Libraries & Frameworks
- jQuery
- jQueryTOOLS
- Spectrum Colorpicker
Summary
The underlying algorithm could easily be used in a general-purpose plotting library, but I have not yet done so. A more detailed description can be found here.
Motivation
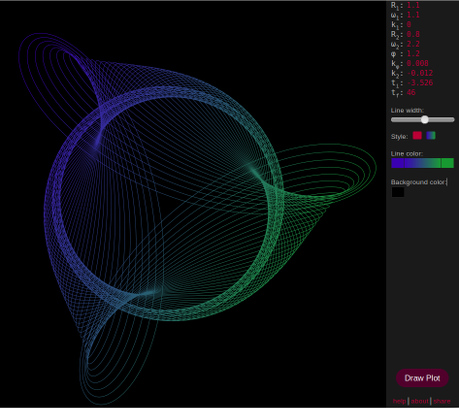
Click the image to view this plot Live! (Internet Explorer is not supported)


GSnap
Dates
Type
Languages
Libraries & Frameworks
- Qt Framework
- OpenMP
Summary
Refer to the paper, Stellar Velocity Dispersion in Dissipative Galaxy Mergers with Star Formation, for examples of the types of analysis that can be performed with GSnap.
Motivation
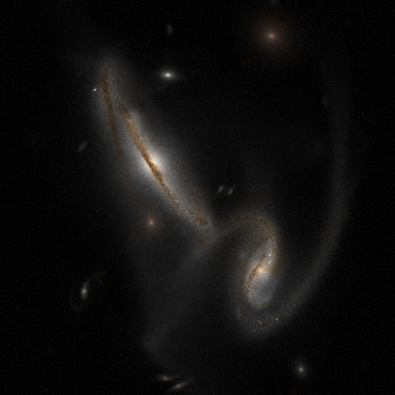
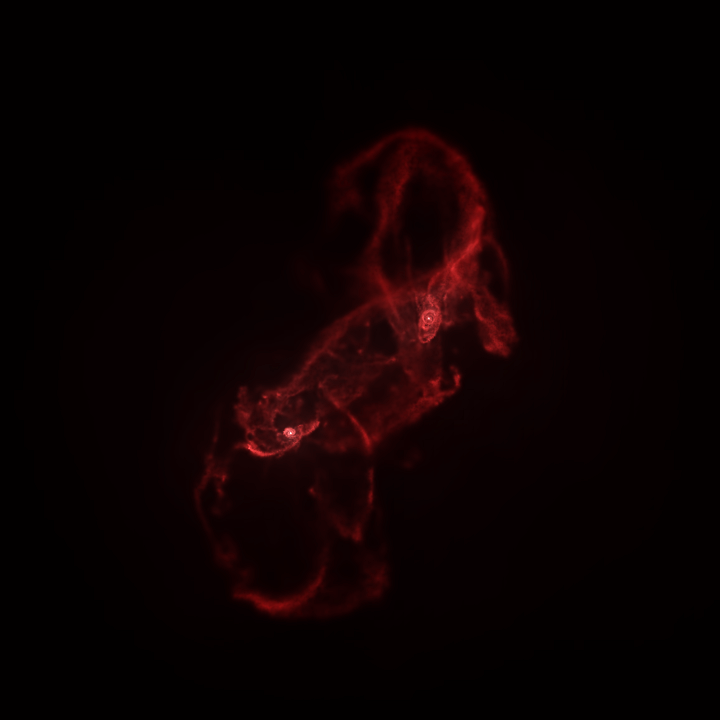
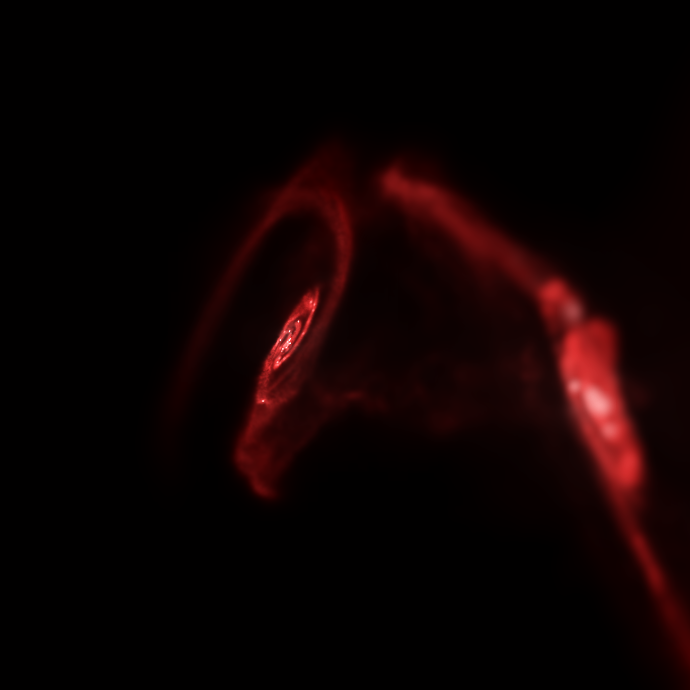
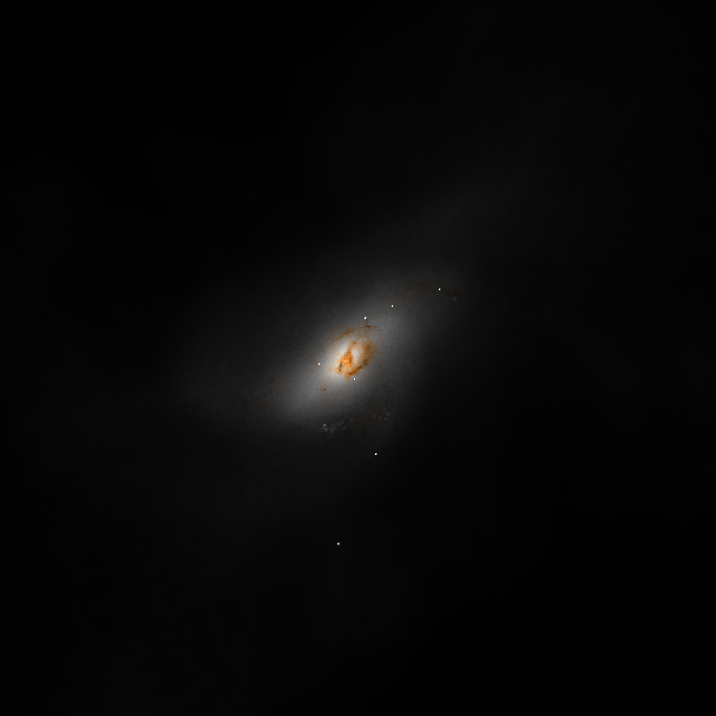
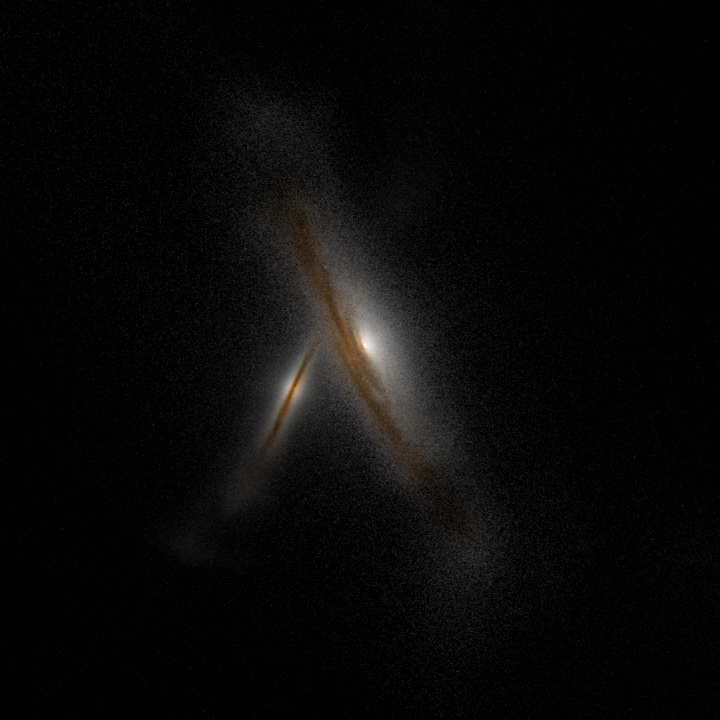
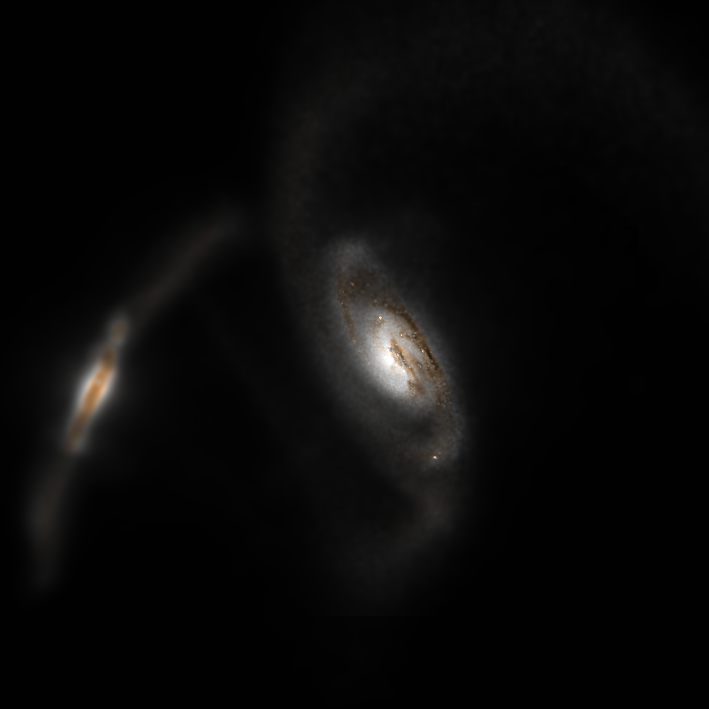
A visualization of a simulation snapshot.
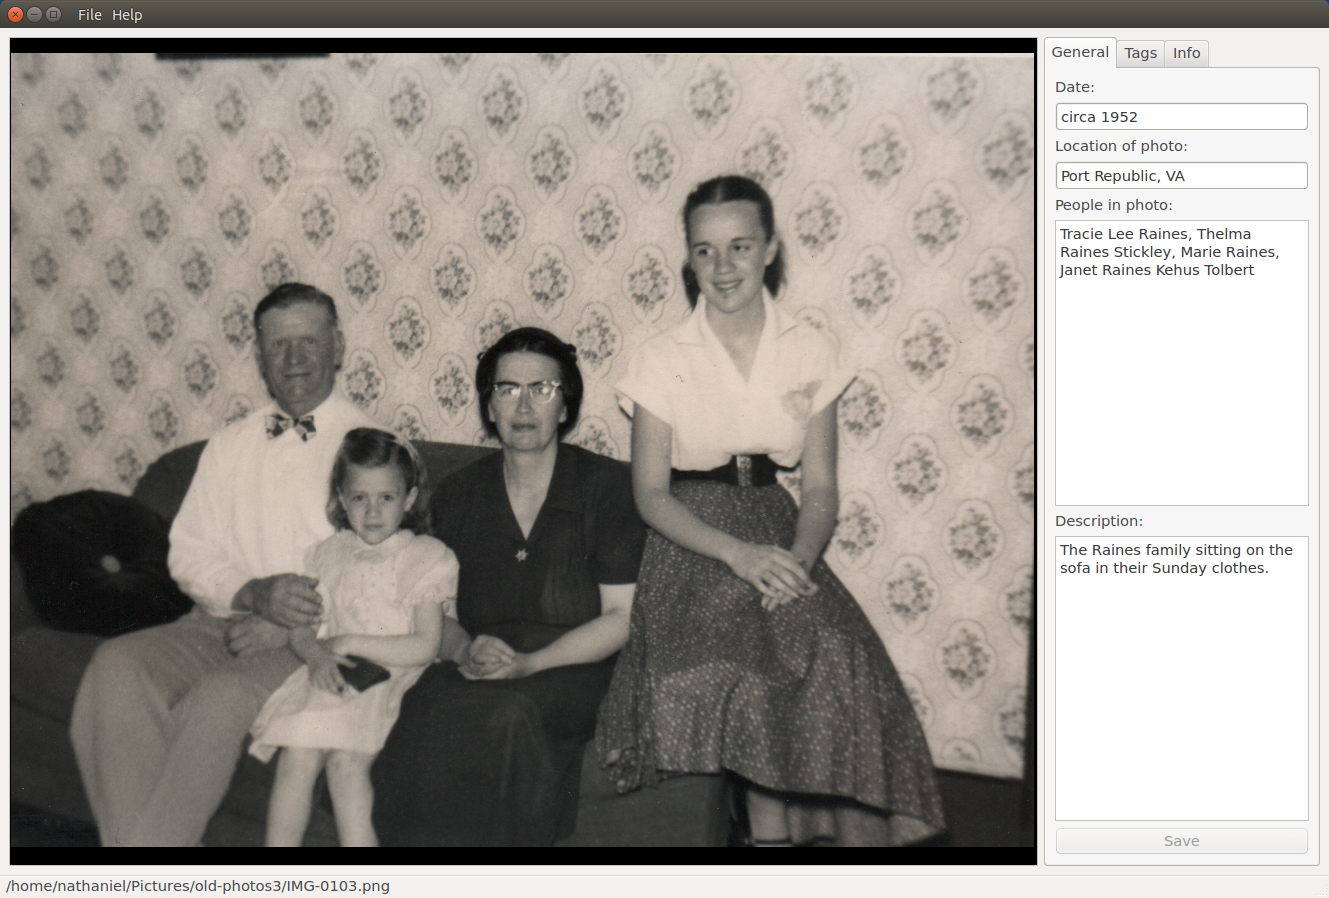
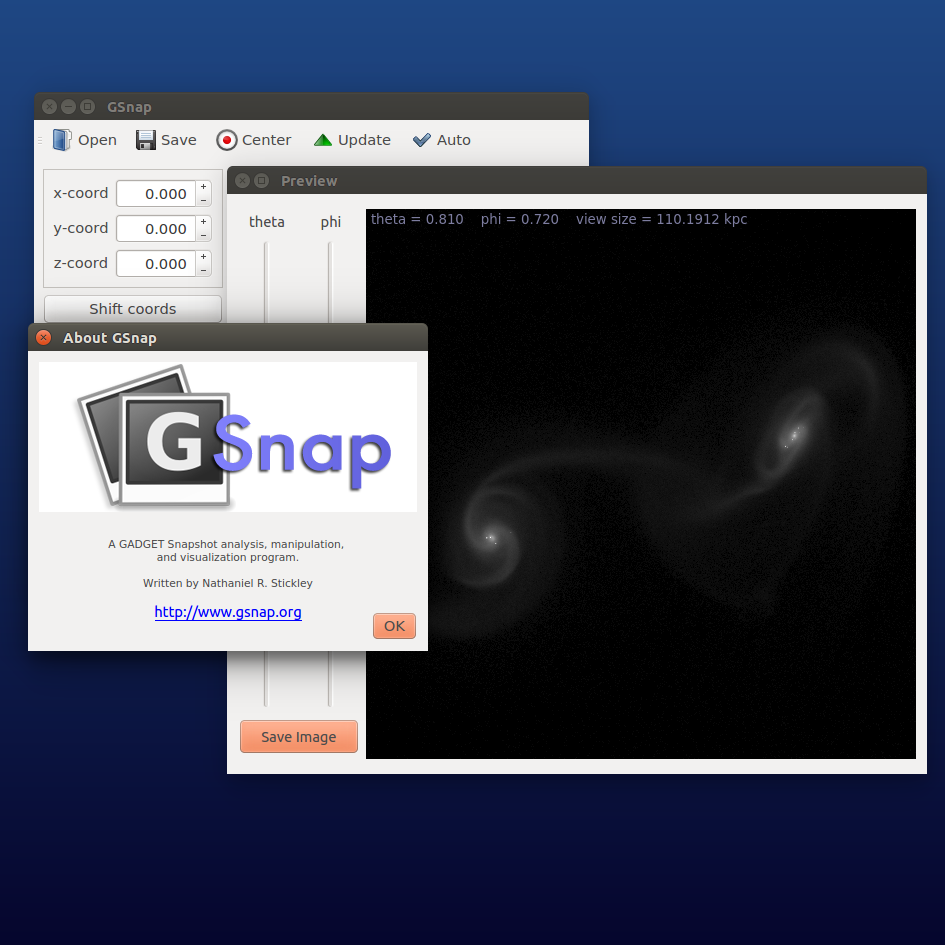 The GUI
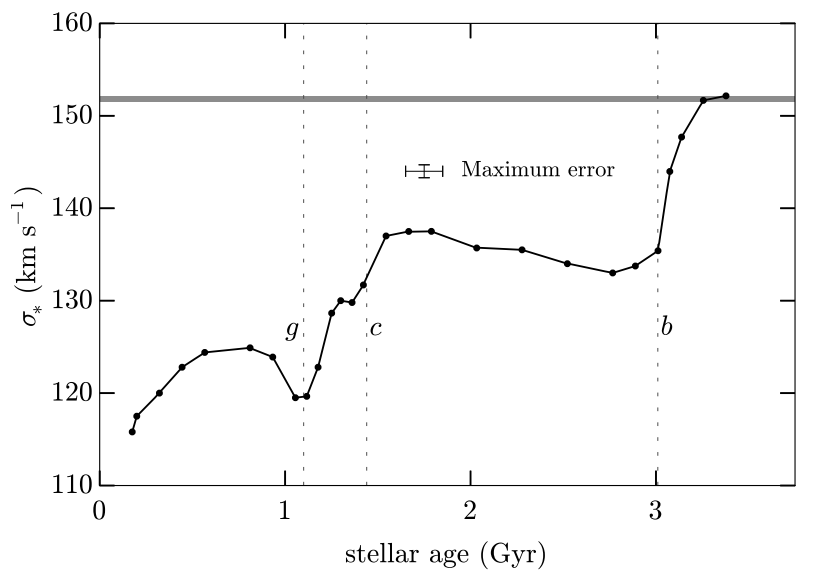
A plot showing how stellar velocity dispersion varies with stellar age after a galactic merger. The merger leaves an imprint on the dynamics of the remnant galaxy. For more info, see the paper.
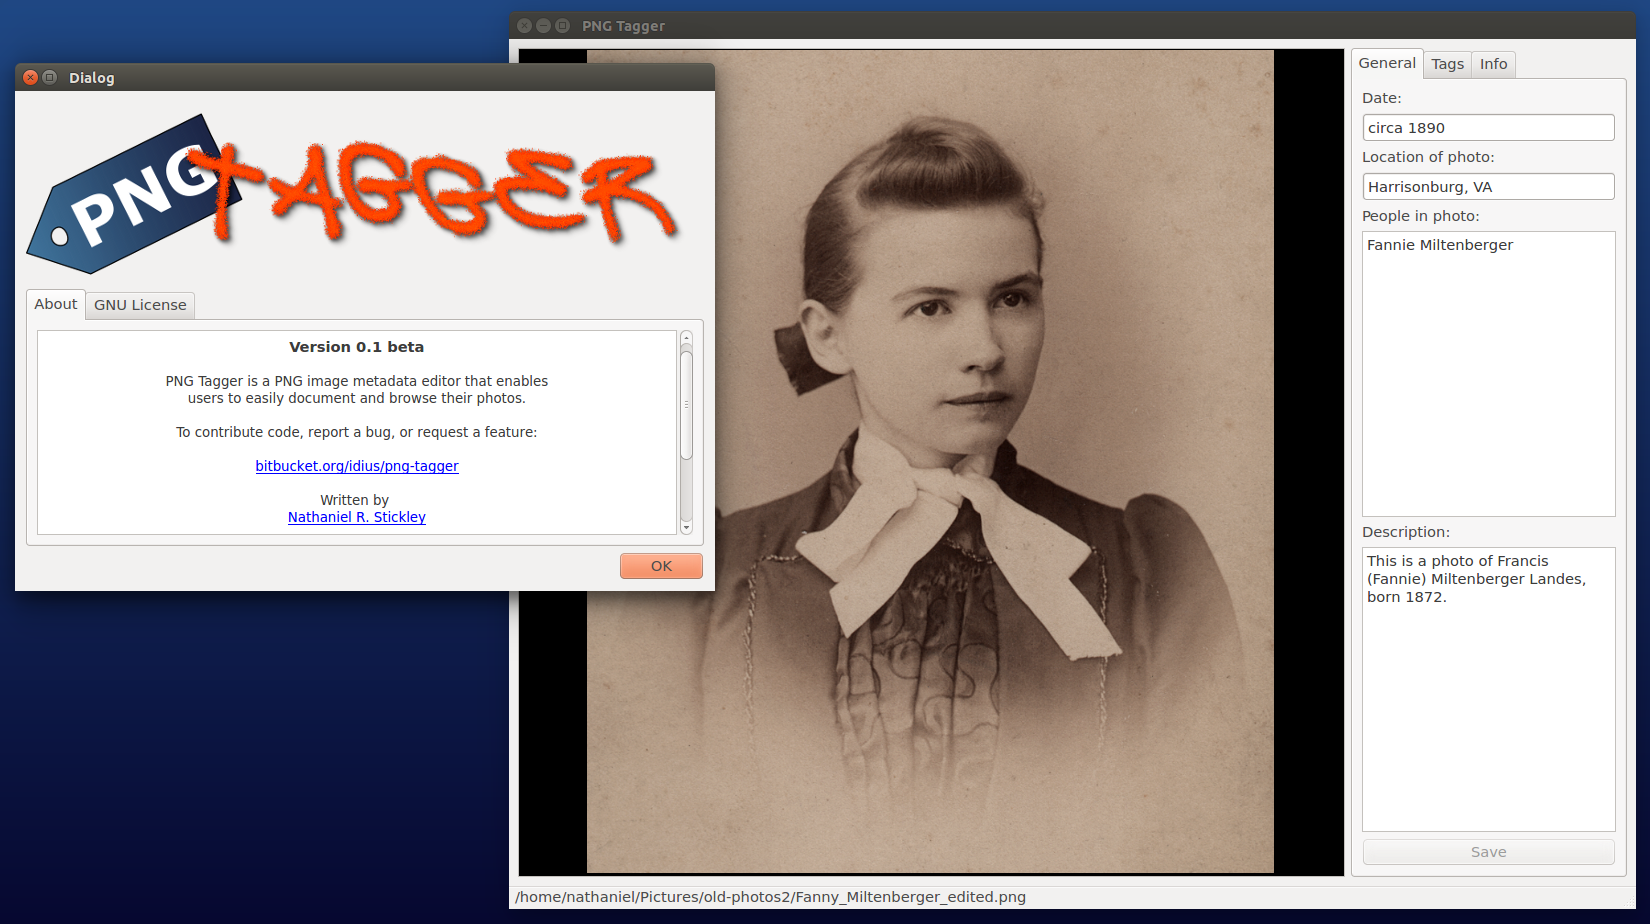
PNG Tagger
Dates
Type
Languages
Libraries & Frameworks
Qt Framework
Summary
In total, less than two full weeks of work have gone into PNG Tagger, but I am interested in adding a few features eventually. For instance, the program will eventually make it easy to filter photos by date range and search for keywords, specific people, and locations. The only way to do this at the moment is to use a program like pngmeta along with grep to do the search from the command line.
Motivation

Direct N-Body
Dates
Type
Languages
Libraries & Frameworks
- Boost
- Magick++
- OpenMP
Summary
- Constructed dynamically stable model galaxies.
- Placed model galaxies on a user-defined collision course.
- Evolved the system of particles forward in time, using an adaptive time-step leapfrog integrator.
- Computed mass-weighted statistics on the stellar dynamics of the system at fixed time intervals. Optionally, a toy model for dust attenuation could be used to perform flux-weighted statistics.
- Generated simple visualizations of the merger from various directions while the statistics were being computed.
The code is described in more detail in the resulting publication.
Motivation
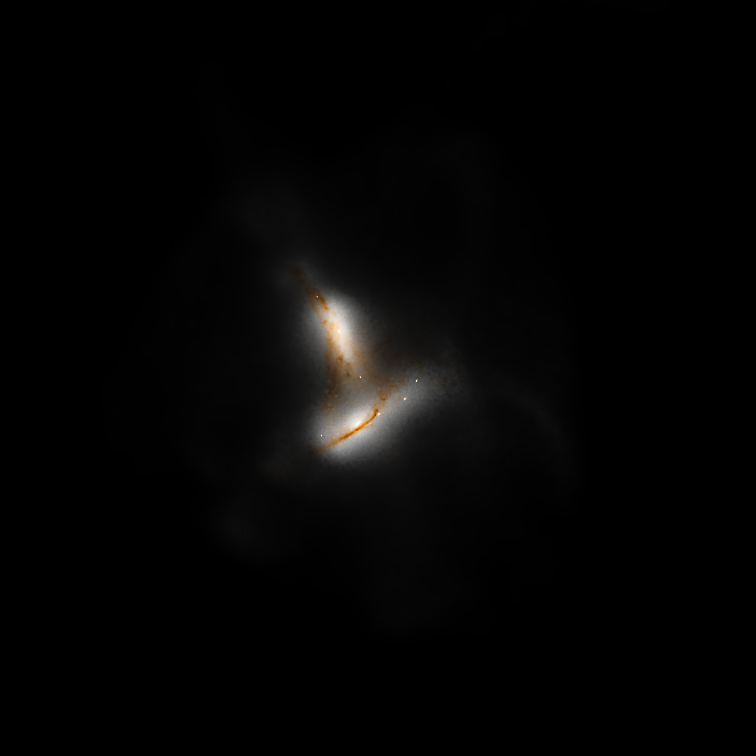
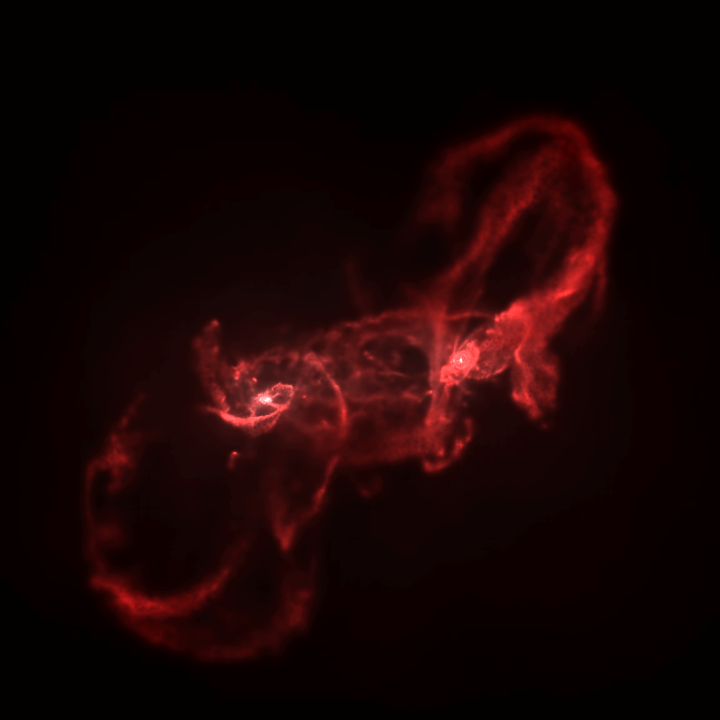
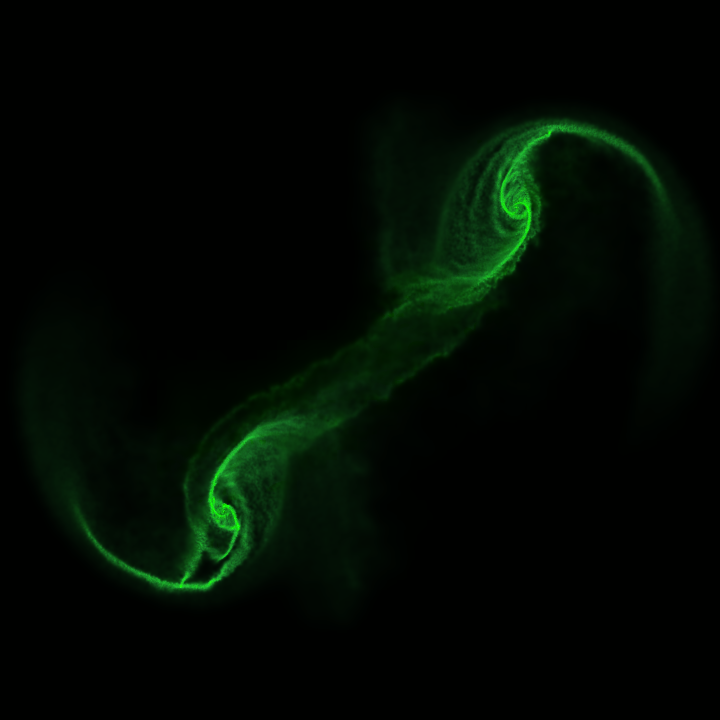
An example of a merger simulation performed by the code.
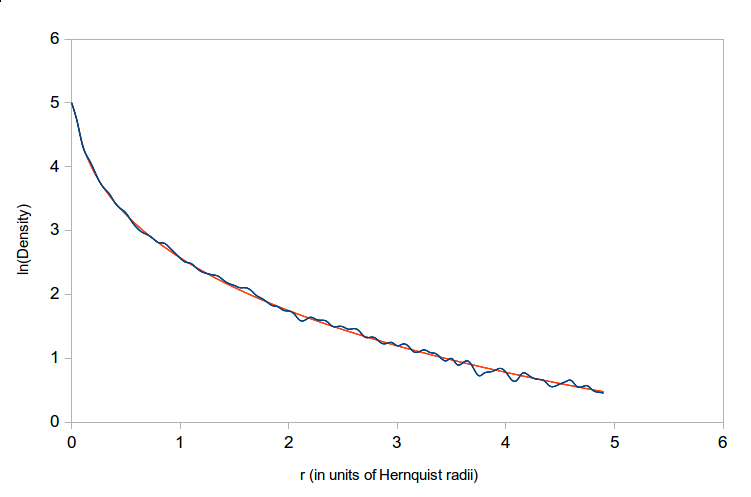
The actual density profile of a model galaxy (black) and the analytic Hernquist profile (red).
OpenConvection
Dates
Type
Languages
Libraries & Frameworks
Summary
Motivation
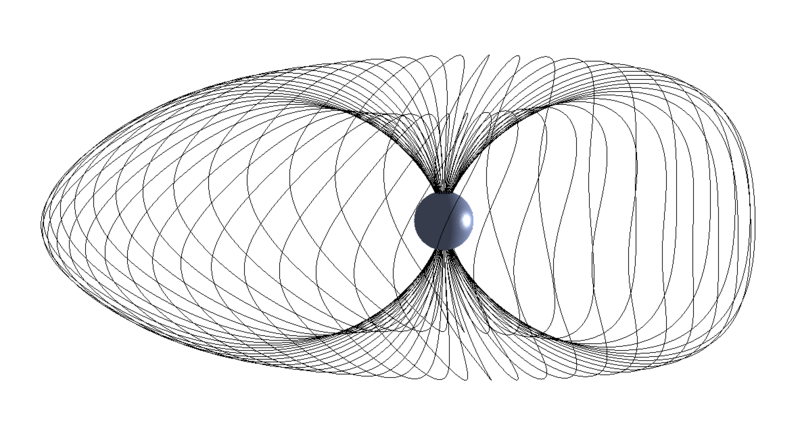
Magnetic field lines on the outer shell of the modeling region.
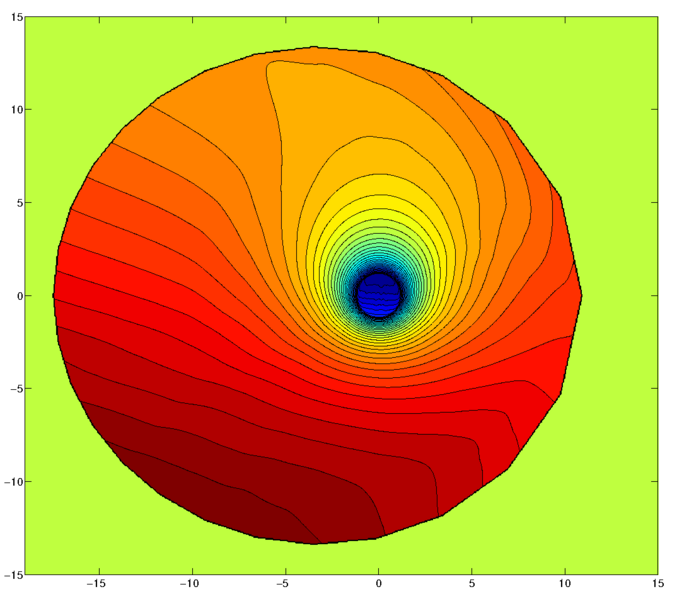
The electric potential during quiescent times (low cross-polar-cap potential). The equi-potentials roughly correspond to pure E × B drift paths. Thus, this plot hints at the well-known duskward bulge of the plasmasphere.
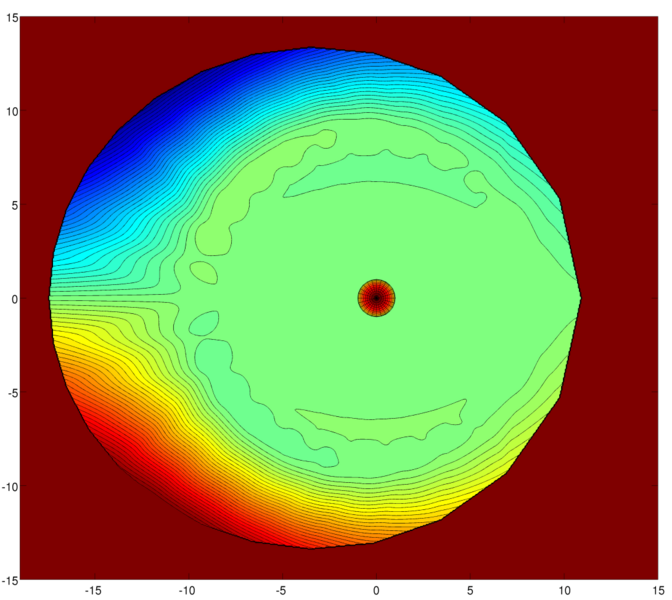
The Birkeland (i.e. magnetic field-aligned) current density in the northern hemisphere, mapped along field lines to the equatorial plane. Red indicates that the current is flowing parallel to the field; blue indicates anti-parallel flow. The position of Earth is indicated with a circle.